


If you think building a marketing budget is as simple as “copy last year’s model and add 10%,” that’s a pretty good sign you’ve never actually built one.
A believable budget requires three things:
(1) real historical data,
(2) awareness of industry trends and efficiency opportunities, and
(3) enough detail to understand channel-level contribution without overengineering your model.
That last part is harder than it sounds.
We’ve seen models that break out conversion rates, pipeline production, and staggered lead → opp → closed-won timing for every individual marketing channel. That level of precision almost never pays off. A good analyst knows the law of averages matters more than hyper-granular modeling—because reality rarely behaves the way your spreadsheet does.
A marketing budget should provide the framework for quarterly spend, not a rigid mandate. Your CMO will almost certainly reallocate dollars as they see what’s working and what’s not. Channel performance fluctuates, seasonality hits, sales behavior shifts—just like forecasting, budget modeling is equal parts art and science (with a few educated guesses about which reps or regions are feeling “optimistic” this quarter).
A good CFO will insist on planning models, so preparing a marketing budget is a must. To get it right, you need two models: a Bottoms Up model and a Tops Down model.
Let’s dig in.
A model is only as strong as its assumptions. If you rely on guesses or bake in too much optimism, you’re setting marketing up to miss targets—and putting the CMO (and their team) in the line of fire.
To build a budget model that’s as accurate as possible, come prepared with the following data:
We recommend gathering key statistics for each of your major lead producing buckets. Here are the most common with the stats you’ll need to gather:
For many organizations, using a single blended conversion rate from lead → qualified opportunity works fine—if you have:
In those environments, a 15–25% lead-to-SQL/Opportunity rate is common and relatively stable.
However, if:
…you’ll want to use channel-specific conversion rates in your model.
If your company is very early-stage or still finding product-market fit, you won’t have the historical depth you need. In that case, use a hybrid approach:
If you plug in perfect benchmark numbers on Day 1 and call it a plan, your marketing leader will be underwater before Q1 wraps.
Before modeling anything, meet with your CMO to understand:
Large investments take time to produce results. Event-driven lead volume is inherently seasonal. Make sure your model reflects those peaks and valleys—and reduces or shifts other investments when needed.
Net-new, expansion, and renewal motions have different economics. You’ll need:
And don’t forget funnel timing. This is one of the biggest points of tension between marketing and the rest of the business. CEOs often expect trade shows to drive immediate revenue when the reality is closer to six months later.
What marketing generates today isn’t felt in revenue until much later. Your model needs to reflect that.
Examples:
If your model isn’t staggered correctly, your revenue projections aren’t just wrong—they’re fictional.
Bottoms Up starts with what actually happened—not what finance or marketing hopes is possible. This kind of model is meant to show how incremental improvements will impact cost and revenue performance. To be realistic, a good Bottoms Up model must be paired with clear context to justify any assumed efficiency gain.
Before building this model, ask:
Based on that information, you’ll need to realistically project improvements tied to either increased spend or increased efficiency from program changes to justify higher lead volume.
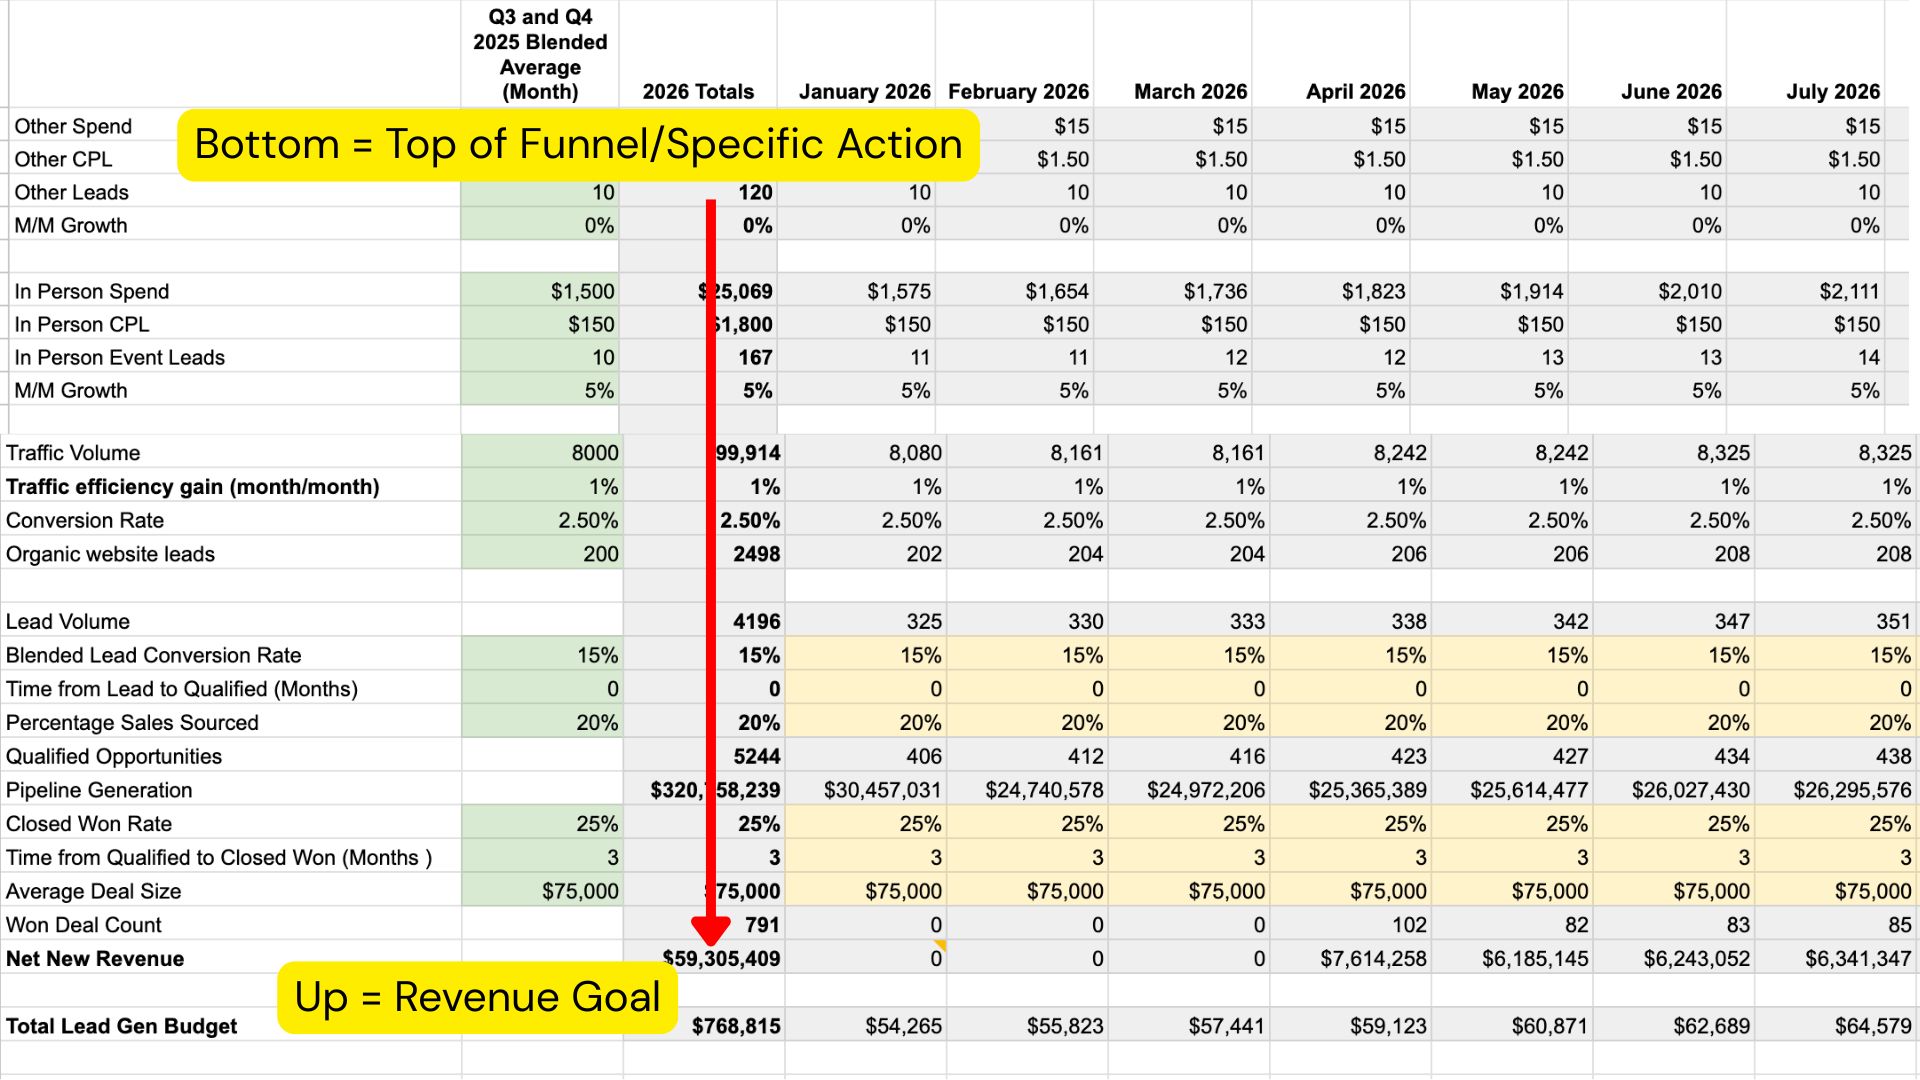
Bottoms Up starts at the top of the funnel, building out impressions and traffic first, then filtering that down to lead production, opportunity creation, and finally revenue. These models are primarily formula-driven with very little manual input.
An example of a Bottoms Up model:
Are you a Rise Community Member? You can access the template here.
Tops Down starts with the company revenue goal and works backward into what marketing needs to invest to hit that goal. These models often expose unrealistic expectations from the board or executive team—like “Marketing will source 60% of net-new revenue next year” when they’ve historically sourced only 30%.
The model should start with the revenue target and work backward to lead generation by source and the budget necessary to hit those lead goals. In other words, you’ll:
An example of a Tops Down model:

Are you a Rise Community Member? You can access the template here.
If your CRM looks like it survived a natural disaster, your job is to:
Example:
If your website converts at 0.05% and your CMO is doing a redesign in January, build in initial traffic gains that taper over time and traffic-to-lead conversion improvements as messaging and ICP targeting improve.
Monthly modeling is essential because:
However, don’t expect quarterly results and spend to happen exactly as you’ve mapped them out.
Sales reps behave differently every month:
CMOs need discretion over their budget. It’s up to them to meet sales where they are and account for lumpy pipeline production.
For example, they should know that spending heavily on paid search in Month 3 isn’t a great idea. Those leads will go cold while top sellers are focused on closing.
Finance will build their own model.
It will not match yours.
Do not panic.
They’re often missing:
Your job is to educate them—not battle them.
Get input from:
Then walk your CFO through the logic step by step.
A good model gets approved.
A great model gets believed—because you provide the right context.


